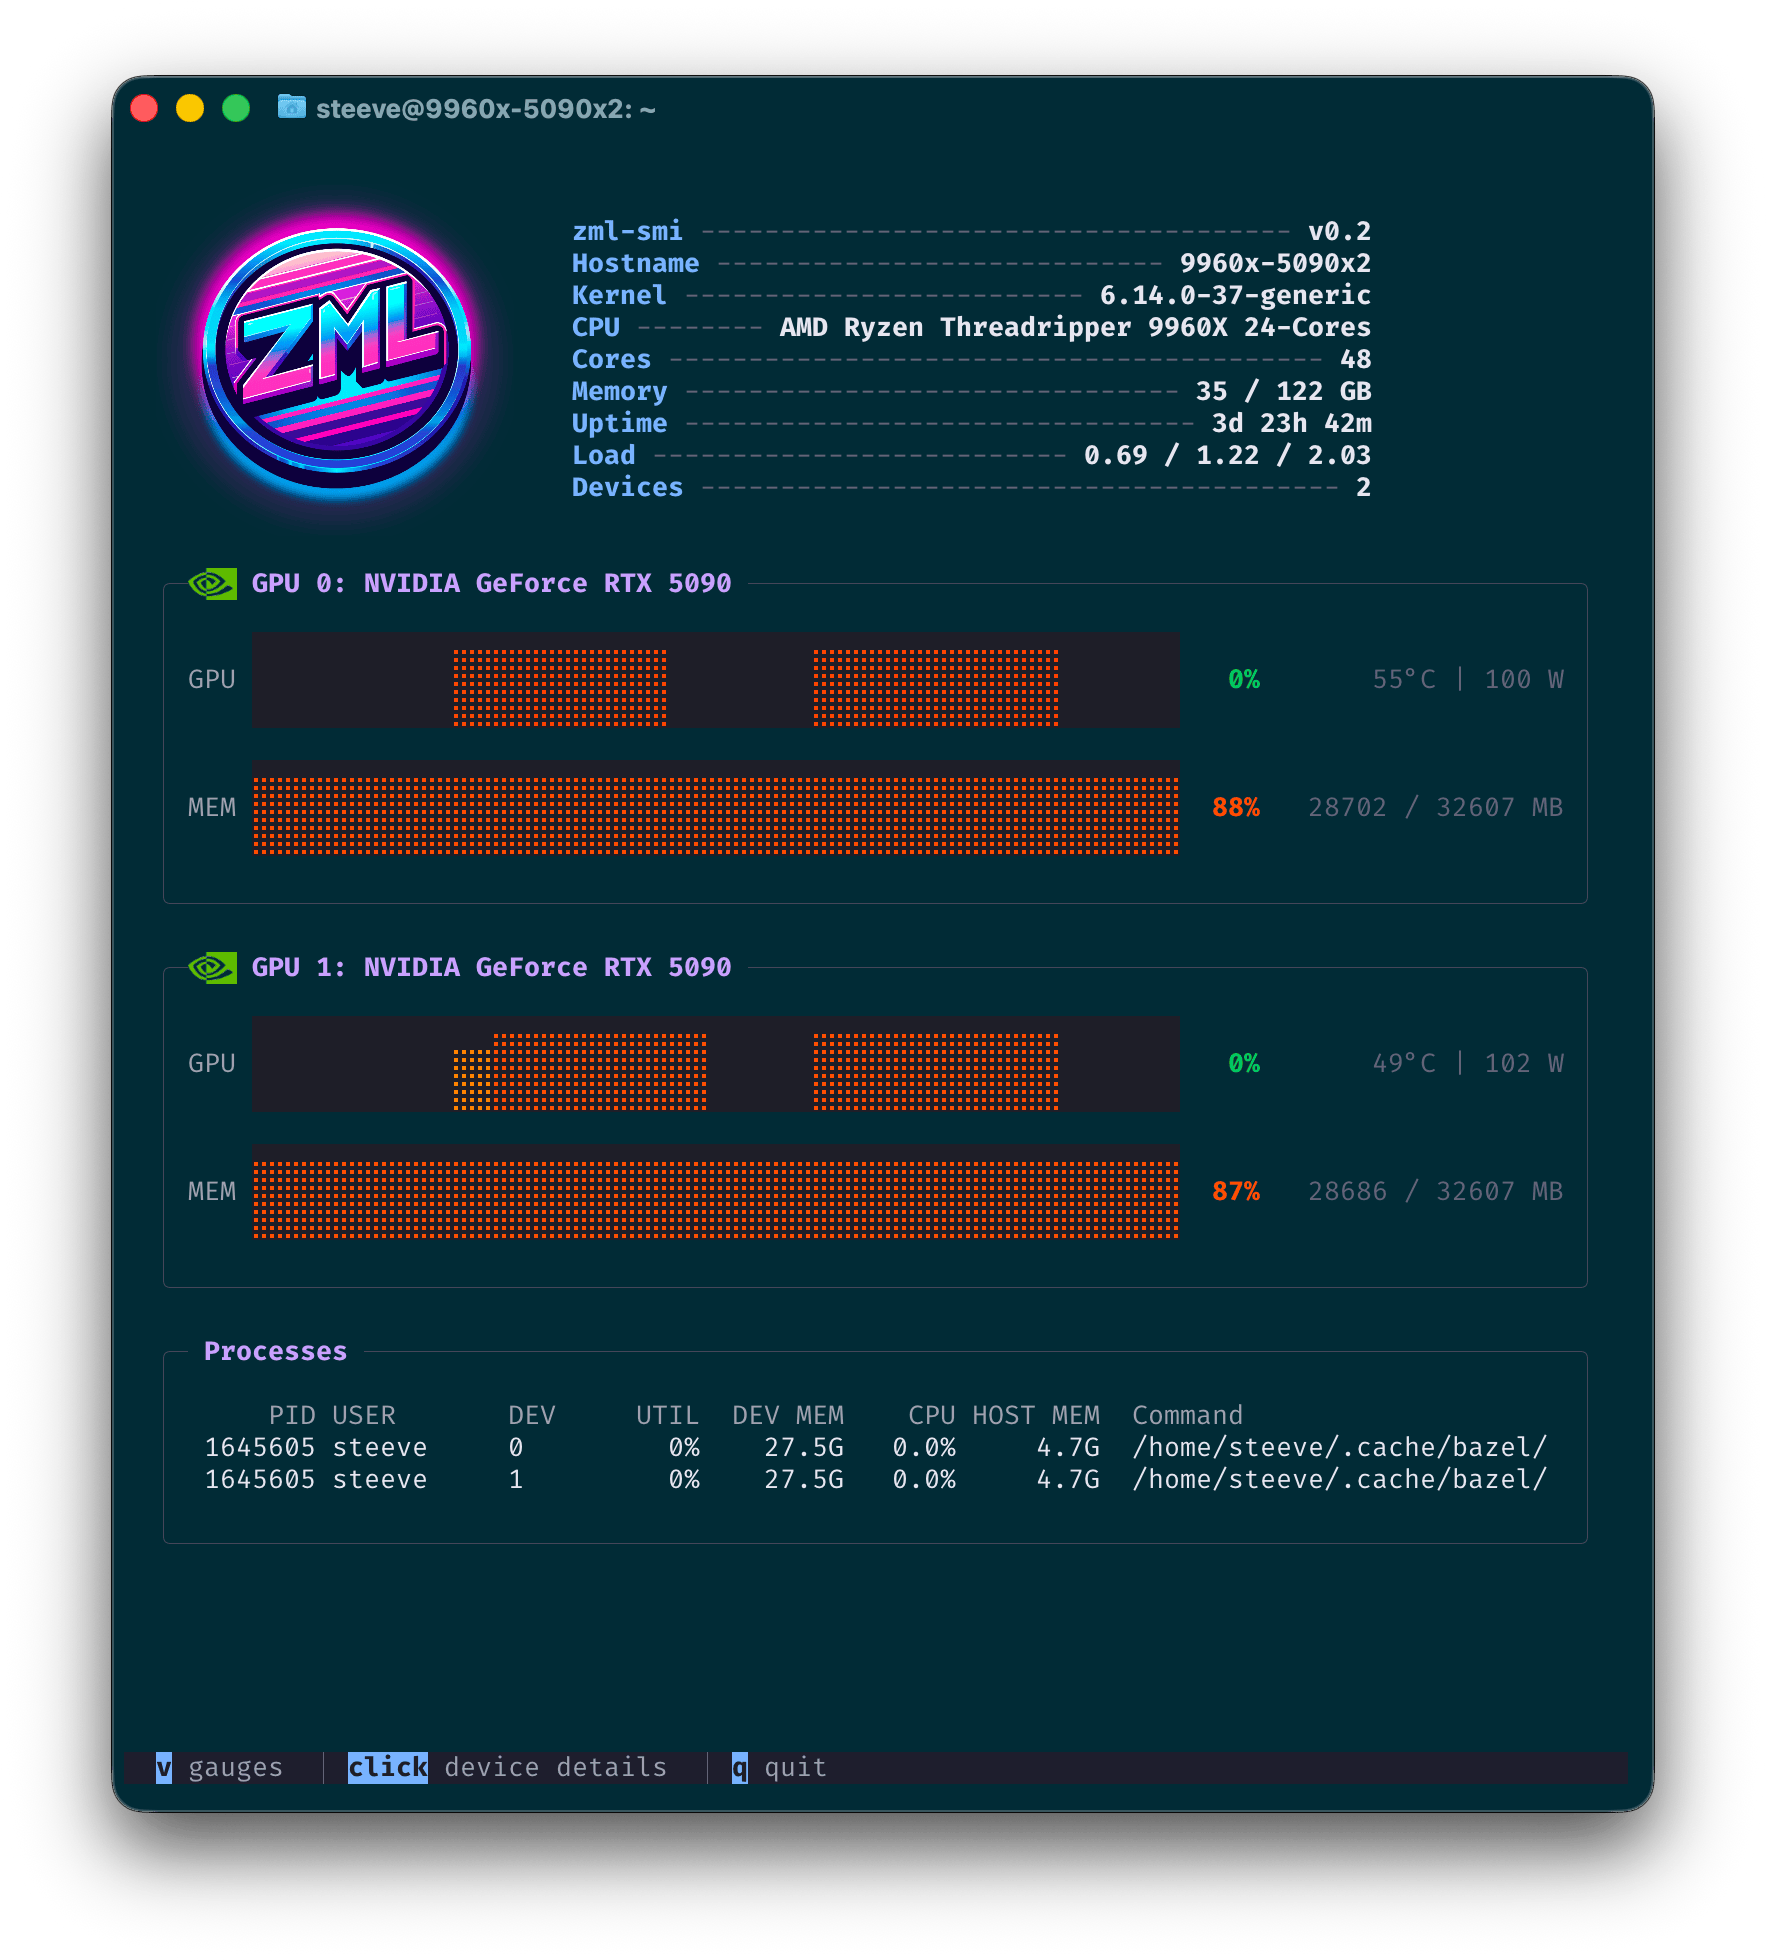
zml-smi is a universal diagnostic and monitoring tool for GPUs, TPUs and NPUs.
It provides real-time insights into the performance and health of your hardware.

It is a mix between nvidia-smi and nvtop.
It transparently supports all the platforms ZML supports. That is NVIDIA, AMD, Google TPU and AWS Trainium devices. It will be extended to support more platforms in the future as ZML continues to expand its hardware support.
Getting started
You can download zml-smi from the official mirror.
$ curl -LO 'https://mirror.zml.ai/zml-smi/zml-smi-v0.2.tar.zst'
$ tar -xf zml-smi-v0.2.tar.zst
$ ./zml-smi/zml-smi
Listing devices
$ zml-smi
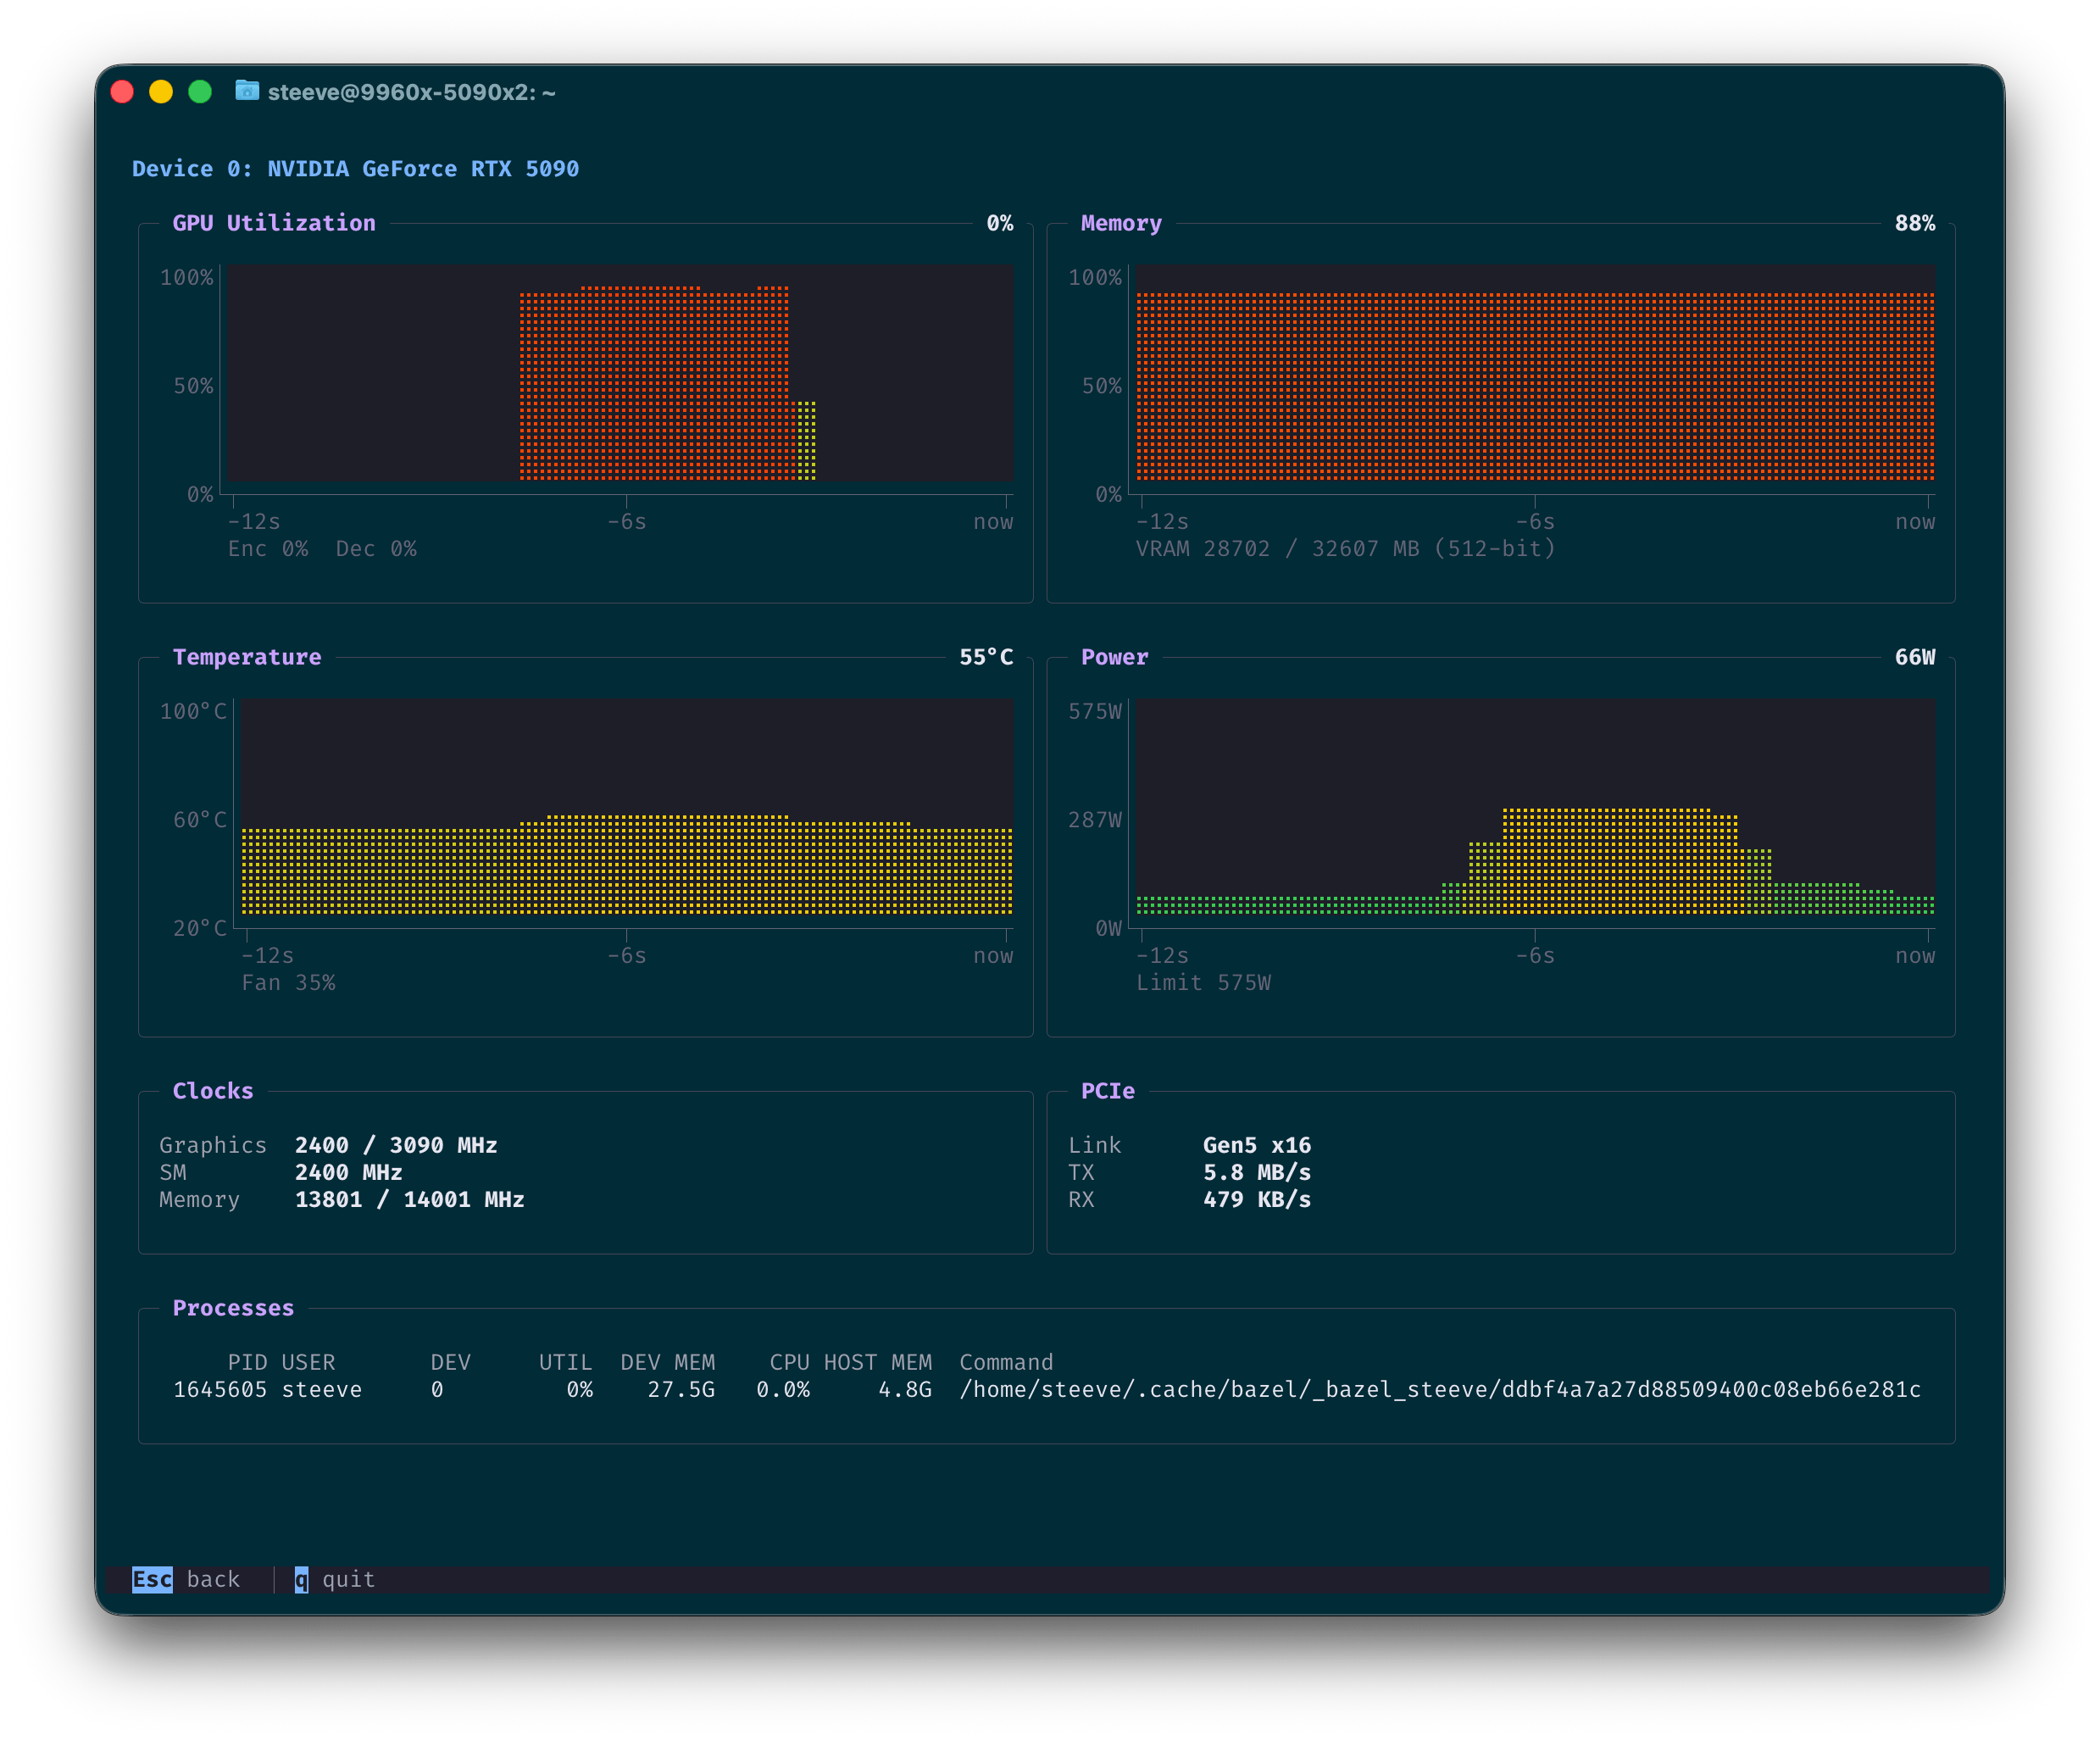
Monitoring devices
The --top flag provides real-time monitoring of device performance, including utilization, temperature, and memory usage.
$ zml-smi --top
Completely sandboxed
zml-smi doesn’t require any software on the target machine besides the device driver and
the GLIBC (mostly due to the fact that some shared objects from vendors are loaded).
Metrics
Host
zml-smi displays host-level metrics such as CPU model and utilization, memory usage, and temperature.
Available metrics
Hostname, Kernel, CPU Model, CPU Core Count, Memory Used / Total, Uptime, Load Average (1m / 5m / 15m), Device Count
Processes
zml-smi also provides insights into the processes utilizing the devices, including their resource usage and command
lines. This is available for all platforms.
Available metrics
PID, Device Index, Device Utilization, Device Memory, Process Command Line
NVIDIA
Metrics are given through the NVML library, which ships with the driver. As such, it is expected to be on the system.
Available metrics
GPU Utilization, Temperature, Power Draw, Encoder Utilization, Decoder Utilization, VRAM Used, VRAM Total, Memory Bus Width, Temperature, Fan Speed, Power Draw, Power Limit, Graphics Clock, SM Clock, Memory Clock, Max Graphics Clock, Max Memory Clock, PCIe Link Generation, PCIe Link Width, PCIe TX Throughput, PCIe RX Throughput
AMD
Metrics are provided through the AMD SMI library.
zml-smi ships with it in its sandbox.
In order to support the latest AMD GPUs, zml-smi at build time downloads the amdgpu.ids file from
both Mesa and ROCm (7.2.1 at the time of this article) and merges them together.
This allows zml-smi to recognize and report on the latest AMD GPU models, even if
they are not yet included in the official ROCm release. This is the case for Ryzen AI Max+
395 (Strix Halo) for instance.
Sandboxing that file turned somewhat tricky. Because libdrm-amdgpu expects to find it in
/opt/amdgpu/share/libdrm/amdgpu.ids, we had to get a bit creative. We didn’t want to install anything
outside the binary sandbox. Nor did we want to patch that string inside libdrm.
So we created a shared object named zmlxrocm.so that is added to the DT_NEEDED section of libdrm_amdgpu.so.1.
Then, fopen64 is renamed to zmlxrocm_fopen64, which is then provided by zmlxrocm.so. Since we now sit between
libdrm and fopen64, we can intercept the call to fopen64, compare the path against
/opt/amdgpu/share/libdrm/amdgpu.ids and redirect it to the sandboxed copy of the file.
Available metrics
GPU Utilization, Memory Usage, Temperature, Power Draw, VRAM Used, VRAM Total, Temperature, Fan Speed, Power Draw, Power Limit, Graphics Clock, SoC Clock, Memory Clock, Max Graphics Clock, Max Memory Clock, PCIe Bandwidth, PCIe Link Generation, PCIe Link Width
TPU
Metrics are provided via the local gRPC endpoint exposed by the TPU runtime. Those are the same metrics exposed to the tpu-info tool from Google.
Available metrics
TensorCore Duty Cycle, HBM Used, HBM Total
AWS Trainium
Metrics are provided through a private API found in libnrt.so, which zml-smi embeds in its sandbox. Those are
the same metrics provided by the neuron-top
utility.
Available metrics
Core Utilization, HBM Used, HBM Total, Tensor Memory, Constant Memory, Model Code, Shared Scratchpad, Nonshared Scratchpad, Runtime Memory, Driver Memory, DMA Rings, Collectives, Notifications